We are disciplined traders at OptionsAnimal. We educate students on how to apply leverage through the use of Options while managing portfolio RISK. The curriculum not only provides an in depth education about options behavior, but also a blueprint from which to build trading activities into a strong business.
Its’ traditional to consider RESOLUTIONS for the New Year, those activities that will make us healthier, wealthier, and happier. This is the perfect time to begin to apply something that is taught in OptionsAnimal’s class on Portfolio Management – Goal Setting. Where do you start?
There is an acronym that serves as a guide to setting SMART goals.
S = Specific
M = Measurable
A = Attainable
R = Realistic
T = Timely
Anyone without experience in applying the process may not know where to start. I offer the following example as one application of the SMART goal setting method. This method can be applied to guide you in getting anything you want out of life, whether for personal fulfillment or career advancement.
Example:
S= Specific (Make this as a definite statement, not a “wish.”) I will graduate from Options Animal by December 31, 2011.
M = The statement above is measurable. You will either have the certificate by that date or not.
A = This is attainable, as many others have proven.
R = This is realistic, as enough time has been built into the goal to make it realistic.
T = It has been given a deadline, and not been left open ended.
Now the goal has been set. But, there is still much more to do.
First consider what steps must be taken to reach the overall goal.
Perhaps you are currently at Level 5 in the curriculum. You have 12 months to complete levels 5, 6, 7, and 8. Then you must meet the requirements for graduation. The graduate candidate seminar is offered once a month. Perhaps target November for participation in that to ensure that your deadline is met. If 2 months are needed to assemble the completed documents for graduation, the levels should be completed by September. That really gives eight to nine months to learn and digest the lessons in levels 5, 6, 7 and 8. Given the time frame you established, you can comfortably spend two months on each level.
Now you have a vision of how you’ll reach your goal. You’re still not finished!
What intermediate steps are required to measure your progress? The level examinations are a good measuring stick for your intermediate progress.
Intermediate Goal: I will graduate from level 5 on, or before February 15, 2011.
a.) I’ll attend each level 5 class once by January 20, 2011.
b.) I’ll take the level 5 exam during the fourth weekend of January to determine weakness that requires more study.
c.) I’l l spend the next three weeks studying that material.
d.) I’ll re-take the exam by February 15th and pass with a 90% or better score.
Now that you see how to break every step down into smaller, measurable, attainable, reasonable and timely goals, you’ll be able to create your PLAN. (I’ve provided a starting point. It needs to be completed through each level and graduate requirement.) You know that if you had stopped after identifying the GOAL, you may not have looked at it again until next fall, then you’d wonder why you didn’t achieve it.
This is really no different than the trading plan that is constructed before each trade, identifying primary and secondary exits. The key is the discipline to flesh it out and put it on paper. Yes….
WRITE IT DOWN AND KEEP IT CLOSE! This is a blueprint for your daily, weekly, and monthly activities. It is your working document that should be handy, not filed away to review later. Make 2011 your BEST year yet! Achieve your goals!
By Emilu Bailes
Source: http://www.optionsanimal.com/new-year-allows-you-invest-smart-set-your-trading-goals-2011
Friday, December 31, 2010
Thursday, December 30, 2010
Using Implied Volatility to Determine the Expected Range of a Stock
When there is an event that is likely to impact the price of an equity (e.g., earnings; FDA ruling; new product release; etc.,) you will see an increase in the option pricing. This rise pricing is attributed to an increase in the option's implied volatility. When the implied volatility is high, that means that the market anticipates a greater movement in the stock price.
I am often asked "How can I determine how far a stock is likely to move?" I will give you two methods to estimate the expected movement: one that requires a calculator and a quick and dirty way that you can do in your head.
First a little theory:
When we talk about historical volatility, we are measuring the zigzaggedness of a stock. How much did it zig and how much did it zag? If it zigged and zagged a lot, the historic volatility is high. In mathematical terms we determine the zigzaggedness by measuring the "standard deviation."
Remember the bell curve or the normal distribution?
http://upload.wikimedia.org/wikipedia/commons/8/8c/Standard_deviation_diagram.svg
If a distribution is considered "normal," 68% of the time, you will be within 1 standard deviation of the peak of that curve. For the most part, stock exhibit a normal distribution. (Actually, it's a lognormal distribution, but let's keep this simple.)
The historic volatility is the movement that did occur. The implied volatility is the movement that is expected to occur in the future. When we are estimating future prices, we use the implied volatility.
Using the calculator:
The following calculation can be done to estimate a stocks potential movement:
(Stock price) x (Annualized Implied Volatility) x (Square Root of [days to expiration / 365]) = 1 standard deviation.
Take for example AAPL that is trading at $323.62 this morning. It has earnings next month. The current Implied Volatility is 31.6%. JAN options expire in 22 days, that would indicate that standard deviation is:
$323.62 x 31.6% x SQRT (2/365) = $25.11
That means that there is a 68% chance that RIMM will be between $298.51 and $348.73 in January expiration.
Quick and Dirty:
Now, for those of you that have not touched the square-root key since you took algebra back in high school, you can just use an options chain to get an estimate of where the stock could move. Find the price of the at-the-money straddle and the out-of-the-money strangle and add them together and divide by two. That is about equal to the 50% probability movement.
For AAPL this is the 320 straddle (320 call and put) and the 310/330 strangle (330 call and 310 put.) Add those together and you will get $30.58. If you divide that by two ($30.58 / 2 = $15.29) and add and subtract that from the current stock price, you get very close to 50% probability range. That means that AAPL has about a 50% chance of being at $308.33 and $338.91 by January expiration.
This method is a enough to make a mathematician cringe. However, it works out to be a pretty good "SWAG," as they say.
Thoughts on what these numbers mean:
I don't use these calculations as a price target to build a strategy. I use them more as a warning sign. Considering the potential movement, you may want to reconsider your delta neutral strategy (e.g., call calendar, put calendar, iron condor, etc.) which profits from a stagnant trend. While the premiums look good now, you might want to wait until after the event for that stagnant strategy. Or, you may be looking at a straddle or strangle knowing that there is going to be a big movement. If you look at those estimated moves, you'll see that a straddle or strangle is probably not that attractive - especially when you consider the volatility crush that is likely to occur after the event.
For example the current JAN 320 straddle on AAPL. It's pricing at $19.40. That means that you need the stock to move to at least $304.22 or $343.02 just to break even by expiration. Now, consider the estimates made above. Does this look like a trade that you'd want to be in? Unless you know something that the market doesn't know - like the iPhone cures the common cold - you probably are best advised to avoid this sort of trade. (Another factor that must be considered is the dramatic changes in implied volatility. But, I will leave that for another post.)
Unless you have a strong sentiment, I believe the most prudent approach is to consider a protective strategy. For stock ownership, I believe that a collar trade is typically best strategy around earnings. It protects you from downward movement in the stock. Also, because there is a long and a short option, the impacts of volatility crush is mitigated. The art is picking the right options and that is what we teach you at OptionsAnimal.
By Eric Hale
OptionsAnimal Instructor
Source: http://www.optionsanimal.com/using-implied-volatility-determine-expected-range-stock
I am often asked "How can I determine how far a stock is likely to move?" I will give you two methods to estimate the expected movement: one that requires a calculator and a quick and dirty way that you can do in your head.
First a little theory:
When we talk about historical volatility, we are measuring the zigzaggedness of a stock. How much did it zig and how much did it zag? If it zigged and zagged a lot, the historic volatility is high. In mathematical terms we determine the zigzaggedness by measuring the "standard deviation."
Remember the bell curve or the normal distribution?
http://upload.wikimedia.org/wikipedia/commons/8/8c/Standard_deviation_diagram.svg
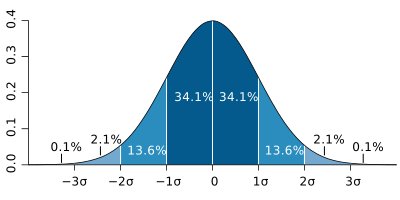
If a distribution is considered "normal," 68% of the time, you will be within 1 standard deviation of the peak of that curve. For the most part, stock exhibit a normal distribution. (Actually, it's a lognormal distribution, but let's keep this simple.)
The historic volatility is the movement that did occur. The implied volatility is the movement that is expected to occur in the future. When we are estimating future prices, we use the implied volatility.
Using the calculator:
The following calculation can be done to estimate a stocks potential movement:
(Stock price) x (Annualized Implied Volatility) x (Square Root of [days to expiration / 365]) = 1 standard deviation.
Take for example AAPL that is trading at $323.62 this morning. It has earnings next month. The current Implied Volatility is 31.6%. JAN options expire in 22 days, that would indicate that standard deviation is:
$323.62 x 31.6% x SQRT (2/365) = $25.11
That means that there is a 68% chance that RIMM will be between $298.51 and $348.73 in January expiration.
Quick and Dirty:
Now, for those of you that have not touched the square-root key since you took algebra back in high school, you can just use an options chain to get an estimate of where the stock could move. Find the price of the at-the-money straddle and the out-of-the-money strangle and add them together and divide by two. That is about equal to the 50% probability movement.
For AAPL this is the 320 straddle (320 call and put) and the 310/330 strangle (330 call and 310 put.) Add those together and you will get $30.58. If you divide that by two ($30.58 / 2 = $15.29) and add and subtract that from the current stock price, you get very close to 50% probability range. That means that AAPL has about a 50% chance of being at $308.33 and $338.91 by January expiration.
This method is a enough to make a mathematician cringe. However, it works out to be a pretty good "SWAG," as they say.
Thoughts on what these numbers mean:
I don't use these calculations as a price target to build a strategy. I use them more as a warning sign. Considering the potential movement, you may want to reconsider your delta neutral strategy (e.g., call calendar, put calendar, iron condor, etc.) which profits from a stagnant trend. While the premiums look good now, you might want to wait until after the event for that stagnant strategy. Or, you may be looking at a straddle or strangle knowing that there is going to be a big movement. If you look at those estimated moves, you'll see that a straddle or strangle is probably not that attractive - especially when you consider the volatility crush that is likely to occur after the event.
For example the current JAN 320 straddle on AAPL. It's pricing at $19.40. That means that you need the stock to move to at least $304.22 or $343.02 just to break even by expiration. Now, consider the estimates made above. Does this look like a trade that you'd want to be in? Unless you know something that the market doesn't know - like the iPhone cures the common cold - you probably are best advised to avoid this sort of trade. (Another factor that must be considered is the dramatic changes in implied volatility. But, I will leave that for another post.)
Unless you have a strong sentiment, I believe the most prudent approach is to consider a protective strategy. For stock ownership, I believe that a collar trade is typically best strategy around earnings. It protects you from downward movement in the stock. Also, because there is a long and a short option, the impacts of volatility crush is mitigated. The art is picking the right options and that is what we teach you at OptionsAnimal.
By Eric Hale
OptionsAnimal Instructor
Source: http://www.optionsanimal.com/using-implied-volatility-determine-expected-range-stock

Wednesday, December 29, 2010
Subscribe to:
Posts (Atom)